
Your Analysts Spend 3 Days On A Deck. WALT Does It In Hours.
Media analysis. Sales pitches. Competitive landscape reports. Still stitched together in Excel.
.webp)
.webp)
Your Analysts Spend 3 Days On A Deck. WALT Does It In Hours.
.webp)
Every agency runs the same painful workflow. Account team needs a sales pitch for a new client. Data analysts pull consumer data from MRI Simmons. Ad intelligence from Pathmatics. Competitive spend from another source. Everything lands in Excel. Pivot tables. Cross-referencing. Synthesizing. Then someone builds charts, finds the insight, writes the narrative, and drops it into PowerPoint. That's 3–5 days of human work for a deck that gets used once.
Same story for media analysis. Account ops teams crawl news articles, run entity extraction and sentiment analysis, cross-reference in Excel, calculate share of voice, reach, media value, and publish a report. Every few weeks. By hand
The problem isn't the data. It's that every source describes the same brand, campaign, or audience differently. One system says "Gen Z females 18–24." Another says "Women, Young Adult." A third uses custom psychographic segments. No machine can synthesize across them without understanding what they mean.
40% reduction in report creation time and cost at a $4B global agency.
What changes with WALT

"What's the competitive ad spend landscape for automotive in Q4 vs Q3?"
"Build me a media presence analysis for this CPG brand with sentiment trends."
"Which audience segments over-index for this product category and under-index for competitor awareness?"
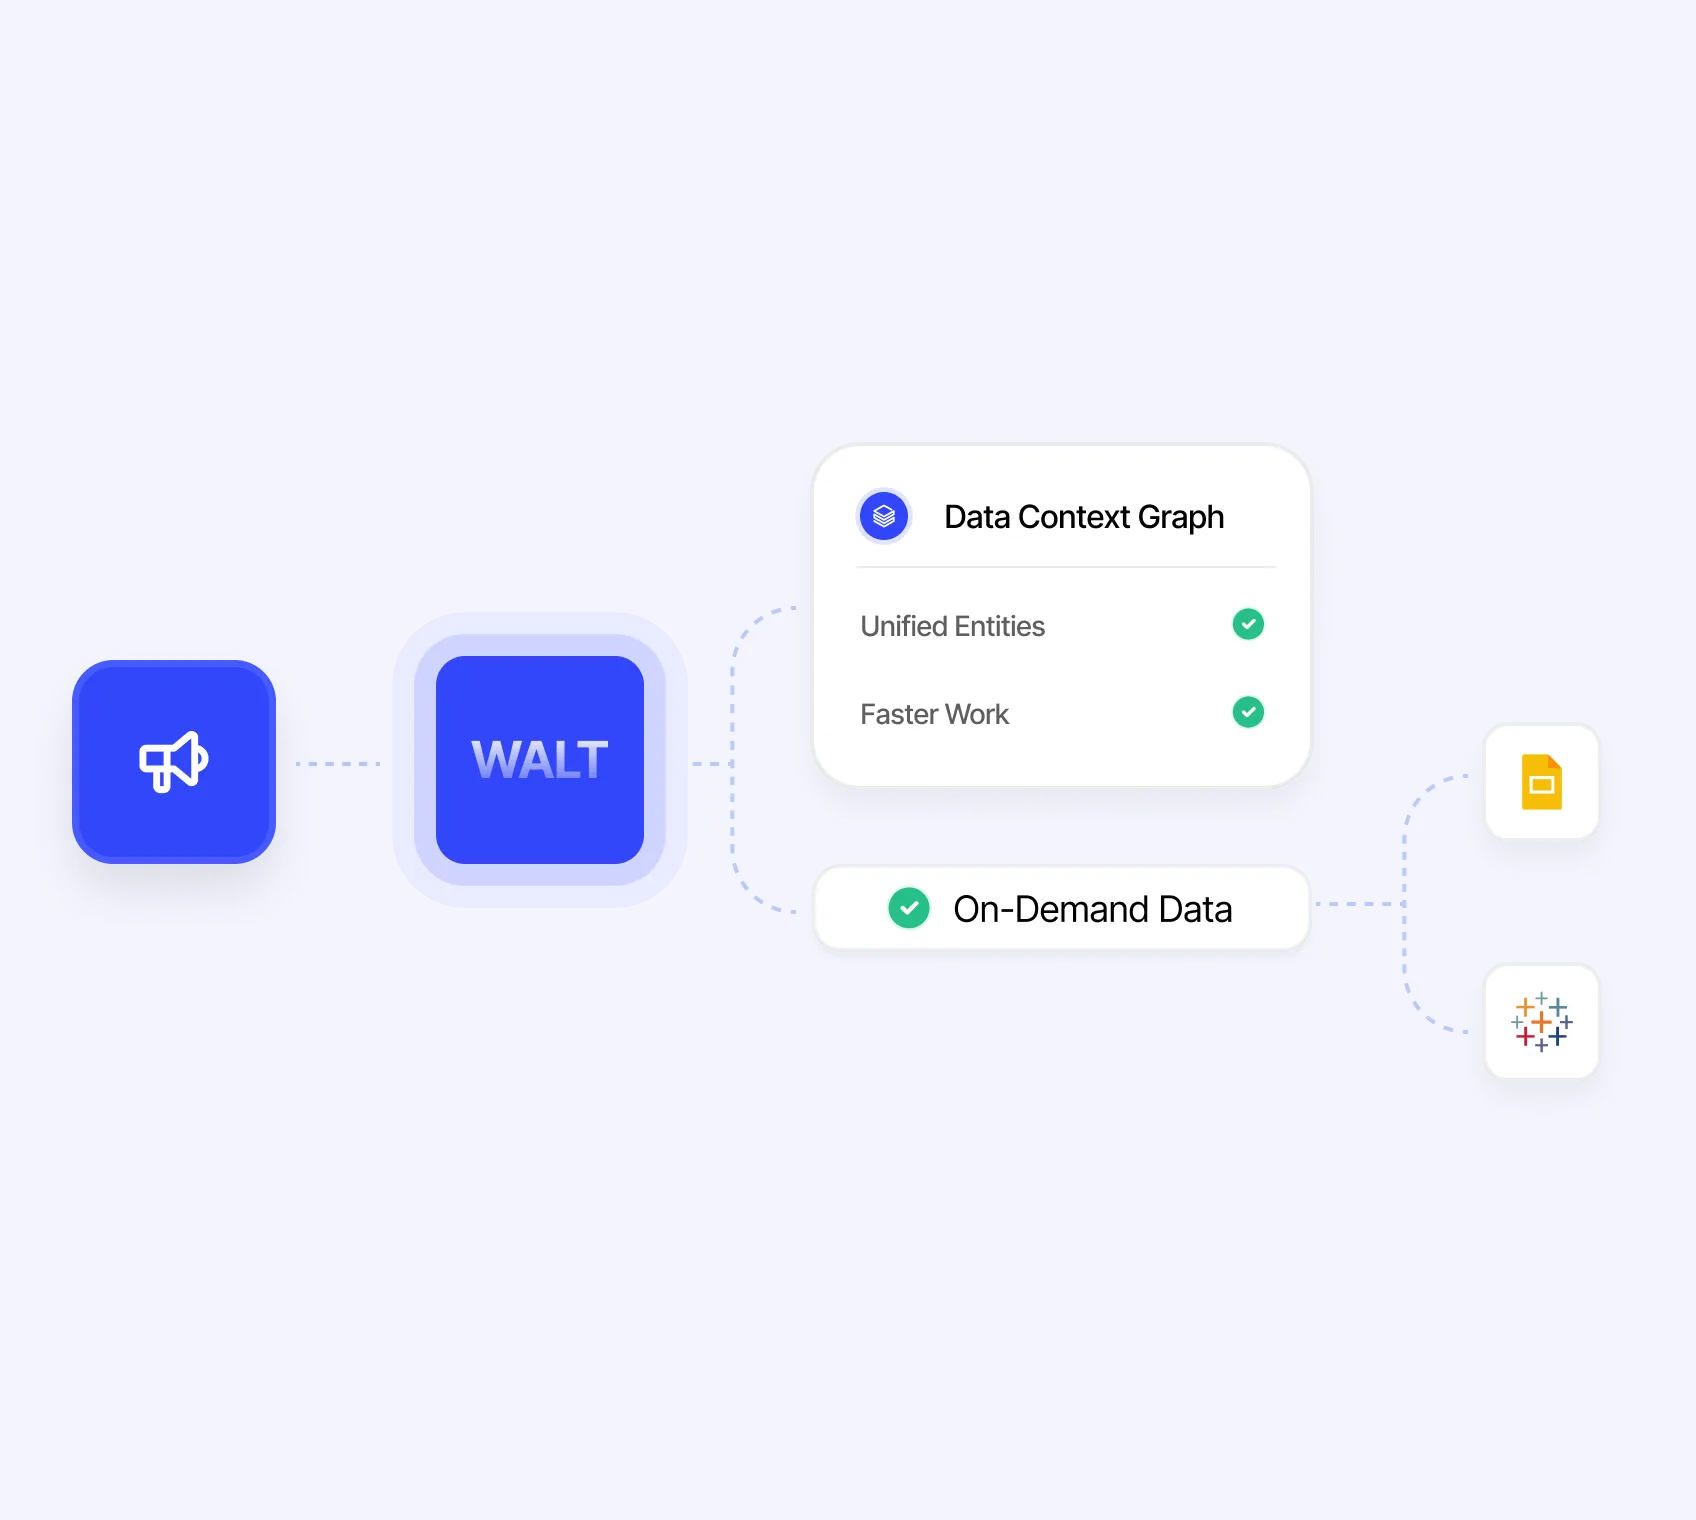
Answers come back in seconds. Deterministic SQL, not LLM guesswork. Same question, same answer, every time. Charts, tables, and narratives ready to drop into a deck.The 3-day pitch deck becomes a 3-hour pitch deck. The bi-weekly media report becomes an on-demand query. Your analysts stop being data plumbers and start being strategists.
What the agents handle
Your existing BI tools (Power BI, Tableau, Google Slides) stay. WALT feeds them. Or replaces them entirely with conversational access. Your choice.

Ingestor
The Ingestor connects MRI Simmons, Pathmatics, social listening tools, and client data feeds.

Reasoner
The Reasoner builds the context graph, resolves entities across data sources, and serves natural language analytics.
.webp)
Transformer
The Transformer builds the marts that power recurring reports.
.webp)
Operator
The Operator monitors freshness so your Monday morning data is never stale.

Meet WALT, your next Data Engineer that builds and runs your entire data platform
.webp)

.webp)