
Data Context Graph: The Reasoning Layer For Data Warehouses
.webp)
Over the last two years, we’ve spoken with hundreds of CDOs. The conversations all surface the same issue. Here’s an example:
"We have revenue. We have revenue_final. We have revenue_corrected. Nobody knows which one is right."
When a human data engineer hits that wall, they know what to do. They trace each field back to its origin: which team created it, when it was last updated, which downstream reports depend on it, and why three versions exist.
They piece together a picture from Slack threads, old pull requests, and a conversation with the analyst who built the original pipeline.
They figured it out because they knew what was missing and went looking for it. They had context built up over months or years: tribal knowledge of your data estate and an instinct for when something doesn’t add up. That context lived in their head.
An AI agent doesn’t know whether something’s missing in the first place. It sees three revenue fields and picks one, or averages them, or returns a result that looks correct, but isn’t.
“While human analysts might work around incomplete or inconsistent datasets, AI agents are more likely to perpetuate and scale biases, errors, or gaps in underlying datasets.” IBM’s 2025 CDO Study on why AI agents struggle to deliver value
What’s missing is a layer that gives your AI agents the same foundational understanding your best engineers already have. This missing layer, providing a shared understanding of what data means, is the data context graph.
What is a data context graph?
A data context graph is an active reasoning layer sitting between your structured source systems (like data warehouses) and every downstream consumer, i.e., business analysts, BI tools, AI agents, and autonomous workflows.
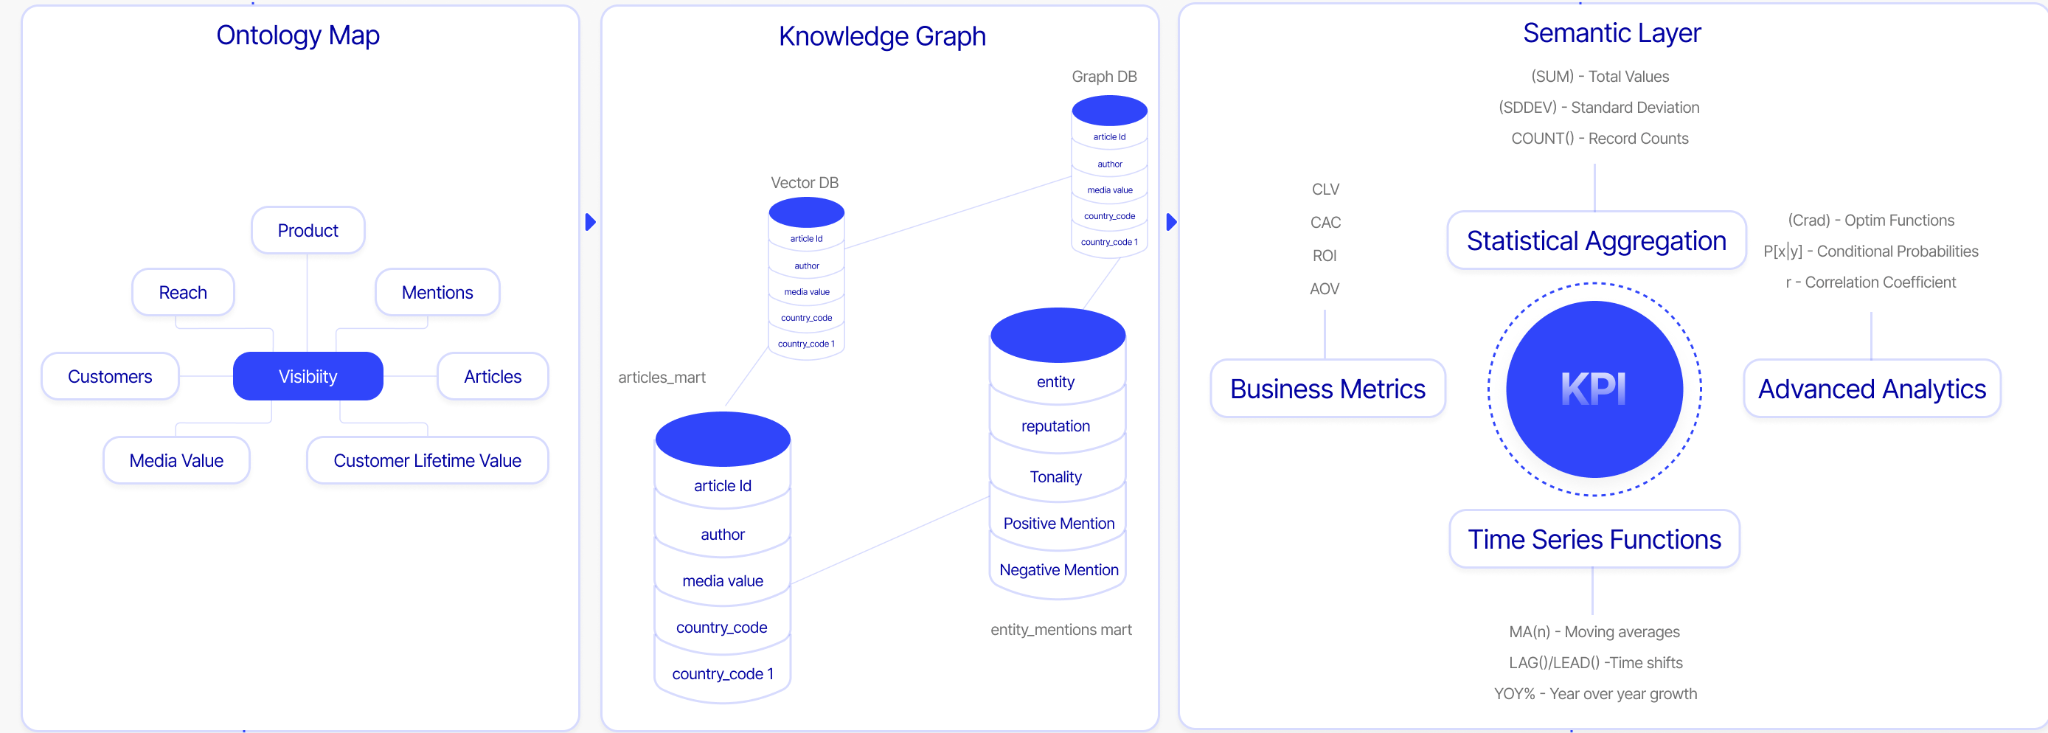
It combines three components:
- Ontology: Resolves business vocabulary into a single shared definition every team and agent can trust.
- Knowledge graph: Maps how entities, data assets, and sources relate to each other.
- Semantic layer: Translates the knowledge graph relationships into governed metrics, dimensions, and KPIs any downstream consumer can query.
When these three components are unified and kept in sync, every question gets the same governed answer and every agent operates on the same ground truth. Without it, AI agents guess, hallucinate, and produce wrong answers confidently.
How does a data context graph bridge the agent readiness gap?
The gap between "we have a data warehouse" and "we are agent-ready" is not a model problem. It is a data context problem. Andreessen Horowitz's analysis of the data agent market confirms what CDOs have been experiencing firsthand: without the right context, AI agents cannot tease apart vague questions, decipher business definitions, or reason reliably across your data.
OpenAI makes this concrete. In January 2026, they published a detailed account of the bespoke data agent they built for internal use. The agent operates across 600+ petabytes and approximately 70,000 datasets. Their engineers stated plainly that generating SQL was not the hard part. Table discovery, reliably identifying the right data assets among 70,000 candidates, was the biggest problem. Even when an analyst found the right tables, producing correct results wasn’t guaranteed:
“Analysts must reason about table data and table relationships to ensure transformations and filters are applied correctly. Common failure modes—many-to-many joins, filter pushdown errors, and unhandled nulls—can silently invalidate results.” OpenAI on the most time-consuming aspects of data analysis
When a human analyst hits one of those failure modes, they notice. They know what a wrong result looks like because they have the context to recognize it. However, an AI agent running the same process won’t have that insight without a reasoning layer that encodes the same foundational context your best human engineers and analysts carry.
A data context graph closes that gap by giving AI agents a live reasoning layer to query directly. It also embeds accountability within your workflows by connecting data to business outcomes: which queries are answered, by which teams, enabling what decisions. That’s the key to measurable ROI from your agentic AI initiatives.
Why building separate ontologies, knowledge graphs, and semantic layers creates fragmentation
Most organizations have attempted to build these components. The ontology lives in a technical dictionary inside a cloud warehouse, used only by the platform team. The knowledge graph is a project someone documented in Confluence. The semantic layer is a business glossary inside a data catalog that governance stewards manage, but that almost nobody queries directly.
The result is a fragmented data estate, where data engineers spend over 60% of their time on data discovery and maintenance. Every change to a source system requires a manual audit of everything downstream. Syncing those changes back upstream is also largely manual.
When AI agents arrived, this fragmentation became the reason every pilot stalled. The IBM 2025 CDO Study, which surveyed 1,700 data leaders across 27 geographies, states that 79% of CDOs are still defining how to scale AI agents to deliver trustworthy outcomes. A unified data context graph is the foundation that makes scaling possible.
What are the core components of a data context graph?
1. Ontology
The ontology resolves business vocabulary. It gives every consumer of your data, human or agent, a single definition they can trust.
Take the word "visibility." For a marketing team, it means content readership. For a finance team, it means financial runway. Without an ontology, an AI agent querying across both teams will produce answers that are technically correct and completely wrong at the same time.
Today, most enterprises rely on a technical data dictionary embedded in each source system, or a business glossary managed by governance teams. These document column names and field descriptions, but they are not shared across teams and are not kept current in real time.
As data estates grow, source systems multiply, and teams change, the gap between what the documentation says and what the data actually means keeps widening.
2. Knowledge graph
The knowledge graph connects business vocabulary to actual data assets. It maps how entities, data assets, and sources relate to each other across your entire data estate.
This graph answers questions like: where does this metric come from? Which table is the authoritative source of record for revenue? If a column changes in a source system upstream, what breaks downstream?
Let’s revisit our previous example. When teams end up with revenue, revenue_final, and revenue_corrected, with no clear record of which one is right or why the others exist, a knowledge graph comes in handy.
Using this graph, a data engineer can trace lineage from source to surface, connecting Tableau dashboards back to the raw tables that feed them and flagging the impact of every schema change before it cascades into broken reports.
Keeping the knowledge graph current manually also becomes exponentially harder as data estates grow.
When someone creates revenue_final, a data engineer has to map concepts to actual columns, i.e., canonicalize them, update that mapping in the data catalog, and propagate the change across the rest of the stack: cloud warehouses, governance tools, BI dashboards, and more. When revenue_corrected appears, the cycle starts again.
3. Semantic layer
The semantic layer is where business logic lives. It translates relationships into governed metrics, dimensions, and KPIs that any downstream consumer can query. Historically, this lived inside BI tools and was managed by humans: a data engineer who knew the business well enough to encode the right definitions and update the entire data stack.
Manual workflows are no longer manageable as the number of metrics, data products, agents, and downstream consumers grows exponentially.
What’s required is an agentic way of harvesting measures, dimensions, and KPIs from across your existing systems, with a human in the loop to verify and release definitions before they propagate.
How the three layers work together
The ontology tells every consumer what a term means. The knowledge graph shows where that term lives in your data estate and how it connects to everything else. The semantic layer governs the logic that produces the correct metric when that term is queried.
A question asked in natural language flows through all three layers in sequence. The ontology resolves what the user means. The knowledge graph identifies the right data assets. The semantic layer ensures the metric is calculated correctly. The result comes back the same way every time, regardless of who asks, which tool they use, or which agent is running the query.
How can you build a unified data context graph that’s agent-ready?
This is where most organizations hit a wall.
Building an ontology, maintaining a knowledge graph, and keeping a semantic layer current across a living, changing enterprise data estate is genuinely hard work requiring deep data engineering expertise. Done manually, it takes months, sometimes over a year.
The same IBM study found that 47% of CDOs are struggling to fill key data roles, up from 32% in 2023. The skills needed to build and maintain a data context graph are exactly the ones that are hardest to hire and hardest to retain.
The traditional options are either hiring a team of senior data engineers, or bringing in consultants from a large systems integrator and giving them 12-18 months, along with a significant budget.
Either way, the graph starts going stale the moment the project ends. A manually built data context graph is a snapshot. What you need is a system that stays current.
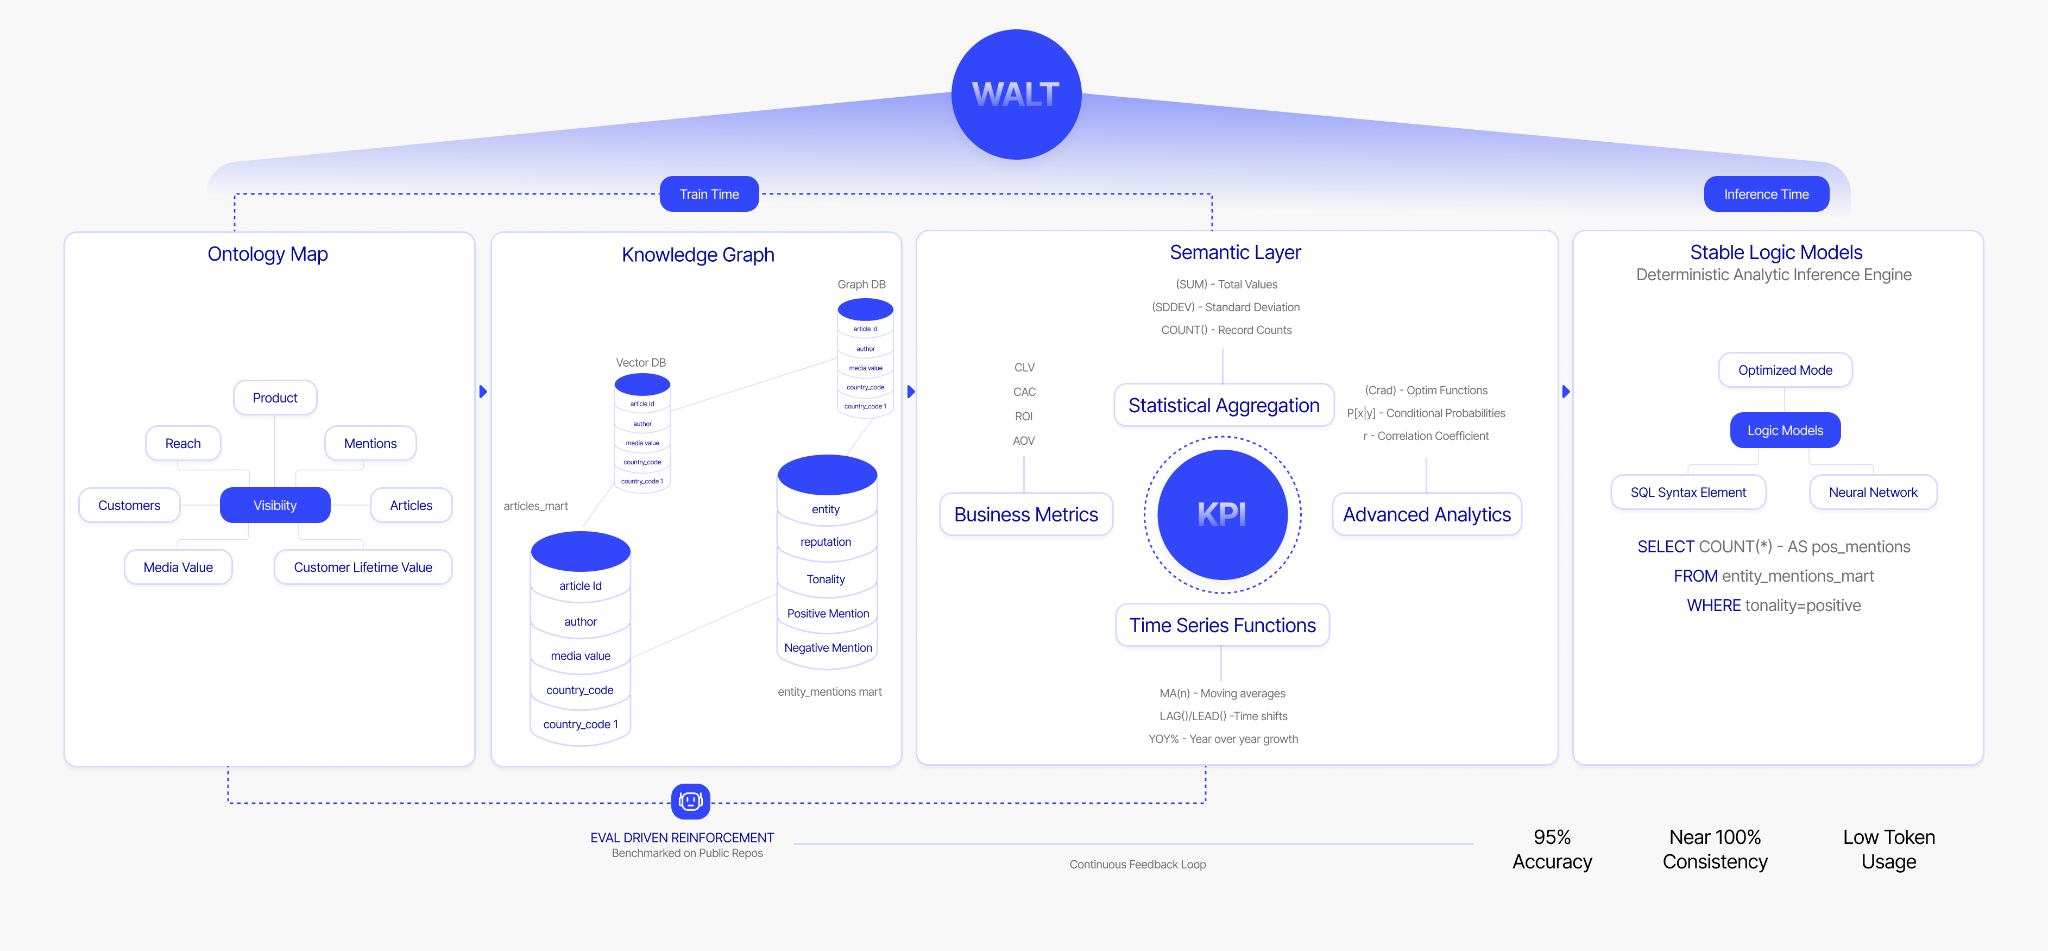
How WALT builds and maintains a unified data context graph within weeks
WALT is an AI data engineer that autonomously builds and maintains the data context graph. WALT handles ontology construction, knowledge graph maintenance, entity resolution, lineage tracking, KPI harvesting from existing BI tools. WALT also continuously, and bidirectionally, syncs everything as your data evolves.
WALT doesn’t replace your data engineers. WALT replaces the work your data engineers shouldn’t be doing in the first place:
- Ontology construction that eats 60% of a senior engineer's bandwidth.
- Lineage mapping that exists in a spreadsheet no one trusts.
- Semantic modeling that requires an engineer to be in the room for any business question to get answered correctly.
WALT makes a smaller team dramatically more productive.
WALT also integrates with the stack you already have. If you have invested in Snowflake, dbt, Tableau, Collibra, or Alation, WALT works to stitch the context together from these systems and keep them updated continuously.
And everything WALT builds–the graph, the pipelines, the semantic layer, the tribal knowledge–stays with your organization permanently.
How WALT makes the data context graph agent-ready with ReasonBaseTM
WALT’s Data Context Graph is a live reasoning layer that agents and humans query directly through a governed interface.
WALT's proprietary implementation of the data context graph is called ReasonBase™. ReasonBaseTM is available as an MCP server, exposing the full reasoning layer as tools for any downstream agent ecosystem: Slack, Copilot, LangChain, or your own custom agents.
Any agent that connects to ReasonBase™ gets reliable, governed, auditable access to your enterprise data, without the hallucination risk that blocks AI pilots from reaching production.
How deterministic SQL ensures the same question always produces the same answer
This is the part most data context graph implementations miss. A growing number of vendors now claim to offer a context layer or an agent that builds one. But context without deterministic execution is still a probabilistic system.
For example, if a vendor gives an AI agent access to your data context graph but still lets an LLM write SQL at inference time, the agent is guessing. When you ask the same question twice, you may get two different answers.
WALT uses a neuro-symbolic architecture to guarantee that the same question always produces the same answer. LLMs handle intent classification only: understanding what you are asking. A deterministic inference engine, Stable Logic Models, constructs the SQL through a formal, auditable process. Every query is traceable back to the exact definition and pattern that produced it.
The customers who have already adopted WALT have noticed 95% query accuracy across enterprise datasets in production.
The data context graph is the missing piece to trusted decisions with AI agents
Your AI strategy doesn’t need a better model, but rather a reliable reasoning foundation for that model.
The data context graph is that foundation: a unified, governed, continuously maintained layer that every downstream consumer, human or agent, can trust to make sense of your structured data. Building it manually is slow, expensive, and fragile. The institutional knowledge it encodes leaves with the people who built it.
Building your enterprise data graph with WALT takes eight weeks, not eighteen months. And everything it builds stays with your organization, permanently.
See WALT build a data context graph in the interactive demo.
Frequently asked questions about data context graphs
1. What is the difference between a data context graph and a decision trace graph?
A decision trace graph is a narrower concept that focuses on recording the reasoning behind past decisions, not just what the data showed, but what logic was applied, what exceptions were granted, and what precedent was set.
The data context graph provides the structured foundation required by a decision trace graph.
2. What is a context-augmented knowledge graph?
A context-augmented knowledge graph describes a knowledge graph that has been enriched with business semantics, not just structural relationships between entities, but the meaning of those relationships in a specific organizational context.
It is closer to what a data context graph provides than a traditional knowledge graph is, though it still treats the semantic enrichment as an addition rather than a core architectural requirement.
3. What is an operational graph?
An operational graph focuses on real-time, runtime operations. Think monitoring, alerting, and pipeline health rather than reasoning. It’s relevant for incident detection, but doesn’t solve the semantic consistency problem that blocks AI agents from answering business questions reliably.
4. What is the difference between a data context graph and a semantic enterprise graph?
A semantic enterprise graph emphasizes connecting business entities across the organization with shared definitions, similar in intent to the data context graph's ontology and semantic layer components.
The difference is that a semantic enterprise graph is often treated as a documentation artifact. Meanwhile, a data context graph is an active reasoning layer that agents and humans query directly, not a reference document.
5. What is the difference between a data context graph and a vector database?
A vector database helps an agent find information. A data context graph helps an agent reason correctly with that information.
Vector databases find semantic similarity between pieces of text or data. They are excellent at retrieval: given a question, surface the most relevant chunks. However, they don’t map explicit relationships between entities, enforce governed metric definitions, or guarantee that the same question returns the same answer every time.
6. Is a data context graph the same as a reasoning layer for structured data?
Yes. A data context graph is the reasoning layer your structured data has always been missing. Structured data–transactions, metrics, KPIs, and operational records–sitting in your data warehouse has documentation tools, catalogs, and semantic layers built for humans. None of it was designed for agents to reason with directly.
A data context graph changes that. It gives structured data a governed vocabulary, a map of how assets connect, and a set of metric definitions that do not shift between teams or tools. An AI agent querying through a data context graph is not guessing at column names or inferring joins from schema alone. It is reasoning on a layer purpose-built to make structured data trustworthy at inference time.
This is why WALT's proprietary data context graph is called ReasonBase™. It is a reasoning foundation for every agent and human that needs to work with your structured data.
7. What should you look for when evaluating vendors selling data context graphs?
A growing number of vendors now claim to offer a context layer or an agent that builds one. Data catalog companies that spent years focused on documentation and governance are repositioning around the same idea. Evaluate carefully.
Here are five questions that matter:
- Does the vendor separate context from execution? Context tells an agent what your data means. Execution is what happens when it queries that data. If you ask the same question twice and get two different answers, then that setup isn’t going to work.
- Is SQL generated or constructed? Generated SQL is stochastic by nature. A language model producing SQL is making predictions. Constructed SQL, built through a deterministic process using predefined analytical patterns and formal logic, is auditable, reproducible, and correct every time.
- Can the vendor show you a production deployment, not a demo? Context graph claims are easy to make on clean data. Ask for evidence from a live enterprise environment with real schema complexity, multiple versions of the same metric, and schema changes over time.
- Who owns what gets built? Some vendors build the context layer inside their own platform, which means the graph, the pipelines, and the accumulated tribal knowledge stay with the vendor. Make sure everything built belongs to your organization permanently.
- Can it couple context and execution? This should be non-negotiable. A context graph without a deterministic execution layer is half a solution. The two have to work together for AI agents to produce results you can trust.


Meet WALT, your next Data Engineer that builds and runs your entire data platform
.webp)

.webp)