
Why Your ERD Cannot Make Enterprise Data Agent-Ready in 2026
.webp)
The traditional Entity Relationship Diagram (ERD) illustrates how entities (objects or data points) relate to each other. Every enterprise data team has one to serve as the official map of your data estate.
ERDs are handy, until a new team joins, a source system renames a column, or a business unit defines "revenue" differently than the one sitting next to it. Suddenly, the ERD becomes a historical document describing what data used to look like, but not what it means right now.
This is the core problem with the traditional Entity Relationship Diagram: it was built to document structure, not to capture meaning. As AI use keeps growing, that distinction is the difference between a system that works and one that hallucinates confidently.
What was an ERD designed to do?
The ERD has been a cornerstone of relational database design since Peter Chen formalized the concept in 1976. Its purpose is to model the logical structure of a database: entities, the attributes that describe them, and the relationships between them.
Done well, an ERD answers questions like: what tables exist, how are they joined, and what does each field contain? It is a structural blueprint. For decades, that was enough, because the people consuming the data were data engineers who already understood what it meant.
As data consumers grew to now include business users, AI agents, and autonomous workflows, traditional ERDs stopped being useful and relevant.
Where do traditional ERDs break down?
1. Traditional ERDs are born stale
Building a traditional ERD is a brute-force effort. A data engineering team works left-to-right: starting from source systems, mapping every table, every relationship, every field. On a large enterprise data estate, that process takes months, and sometimes a year or more.
By the time the diagram is finished, it is already out of date as a source system has changed, a new product line was added, or a merger brought in three new data environments. Traditional data platforms optimized for usability at the edges while leaving the deeper issues, trust, coherence, and sustainable cost structures, unresolved.
The ERD reflects the data estate at the moment it was built, like a snapshot.
2. Traditional ERDs document structure, not meaning
An ERD can tell you that a table called orders has a foreign key to a table called customers. It cannot tell you that "visibility" means content readership for the marketing team and financial runway for the finance team. It also cannot tell you that revenue_1, revenue_2, and revenue_final represent three different calculations built by three different teams at three different points in time.
So, every executive dashboard would show a different number and your data engineers end up spending hours every week reconciling which figure is correct before any strategic conversation can happen.
3. They cannot handle naked data
Decades-old legacy systems and mainframe environments often have no primary keys, no foreign keys, no indexes, and no documentation. Their schema logic is embedded in application code that nobody has read in fifteen years.
Consider this scenario: a large manufacturer runs its supply chain on a system built in the late 1980s. There are no formal relationships defined anywhere. The joins that make the data queryable exist only in the head of an engineer who has been with the company since the system was installed.
How the traditional ERD evolved into a knowledge graph
The ERD was the right tool for a different era of data. When data lived in tightly scoped relational databases and the consumer was always a trained engineer, documenting structure was enough.
As data estates grew, tables multiplied, source systems fragmented, and business logic migrated out of databases and into application code, analyst notebooks, and Slack threads. The knowledge graph emerged as the answer to that problem. Where an ERD maps the physical layout of data, a knowledge graph maps the conceptual one.
A knowledge graph maps how data assets relate to each other: which tables connect, which columns map to which business concepts, and where data flows from source to dashboard.
Let’s consider a scenario. A retail company has three tables: orders, order_items, and fulfillments.
An ERD shows the JOIN paths between them. However, it does not tell you that "revenue" in the executive dashboard is calculated from fulfillments.shipped_value, not orders.total_value, because returned orders are excluded at the fulfillment stage.
The ERD also doesn’t tell you that a data analyst made that decision three years ago after an all-hands quarterly reconciliation meeting, and that the logic lives nowhere except in the analyst’s memory.
A knowledge graph captures that institutional knowledge. It maps the concept of "revenue" to the column that carries the governed definition, connects it to the downstream dashboard that depends on it, and flags every asset that would break if the fulfillment schema changed.
What is the context gap, and how does a knowledge graph help close it?
The failures listed above produce a single, compounding problem: the context gap. Your data warehouse has petabytes of structured data and your AI agents have access to all of it. But without context, they cannot produce meaningful outcomes.
Here’s a scenario. A healthcare organization runs an AI pilot to analyze patient readmission rates. The model has access to the clinical data warehouse, but it does not know that:
- "Readmission" is defined differently across three hospital campuses.
- One campus excludes planned readmissions and two others do not.
- The field it is querying was introduced six months ago to replace a deprecated one with slightly different logic.
As a result, the model produces outcomes that look correct, but aren’t. This is the context gap. We’ve noticed several organizations using LLMs to fill the context gap, but that won’t work.
Why LLMs alone cannot solve this
Standard LLMs are stochastic: the same question asked twice can produce different SQL. A field called revenue_1 and a field called revenue_2 may be treated as interchangeable, when they represent completely different calculations. Column names like I-95 and I_95 may be interpreted as two separate entities when they refer to the same highway.
How a knowledge graph closes this gap
By mapping which columns carry authoritative definitions, how entities relate to each other, and where data flows from source to dashboard, the knowledge graph gives every downstream consumer, human or agent, a stable ground truth for reasoning.
It is the layer that tells an AI agent that revenue_final is the governed field, that the three hospital campuses define "readmission" differently and here is how, and that I-95 and I_95 are the same entity.
But the knowledge graph is one component of something larger. On its own, it handles relationships and lineage. To make an enterprise fully agent-ready, it needs to work alongside an ontology that resolves vocabulary and a semantic layer that governs metrics.
Together, those three components form a data context graph, and that is the complete reasoning layer that makes reliable AI inference possible.
The reasoning layer: Three pillars of a living data context graph
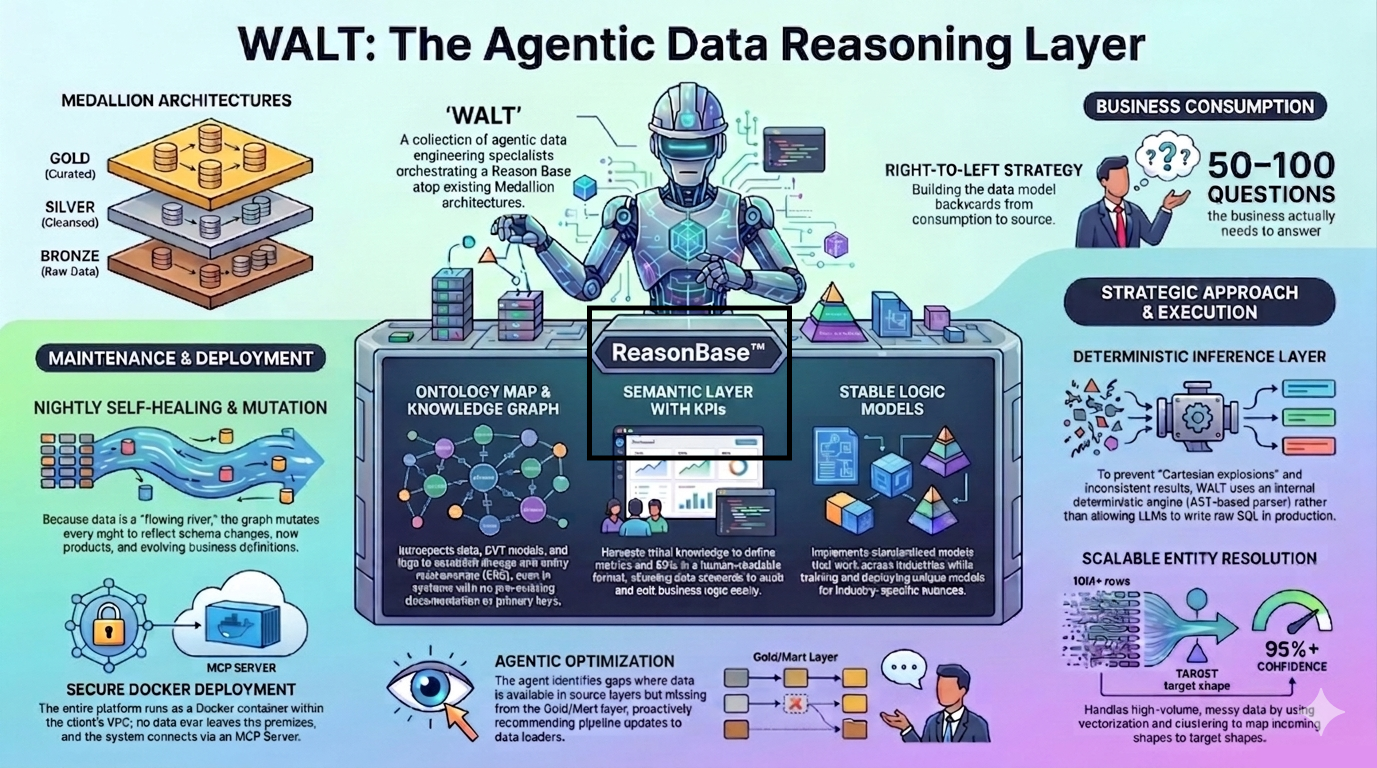
The missing piece between a structural ERD and a working knowledge graph is a reasoning layer that sits between your data engineering infrastructure and every downstream consumer. At WALT, this is the Data Context Graph, built on ReasonBase™ and its components are:
- Ontology: Resolves business vocabulary into a single shared definition every team and agent can trust. "Visibility" means content readership for marketing and financial runway for finance. The ontology maps the ambiguity and returns the right answer for the right consumer.
- Knowledge graph: Maps how entities, data assets, and sources relate to each other across the full data estate. It answers: where does this metric come from? Which table is the authoritative source for revenue? What breaks downstream if this column changes?
- Semantic layer: Translates knowledge graph relationships into governed metrics, dimensions, and KPIs. This is where business logic lives. Every KPI is stored in human-readable format, centrally governed, and queryable by any downstream consumer, human or agent.
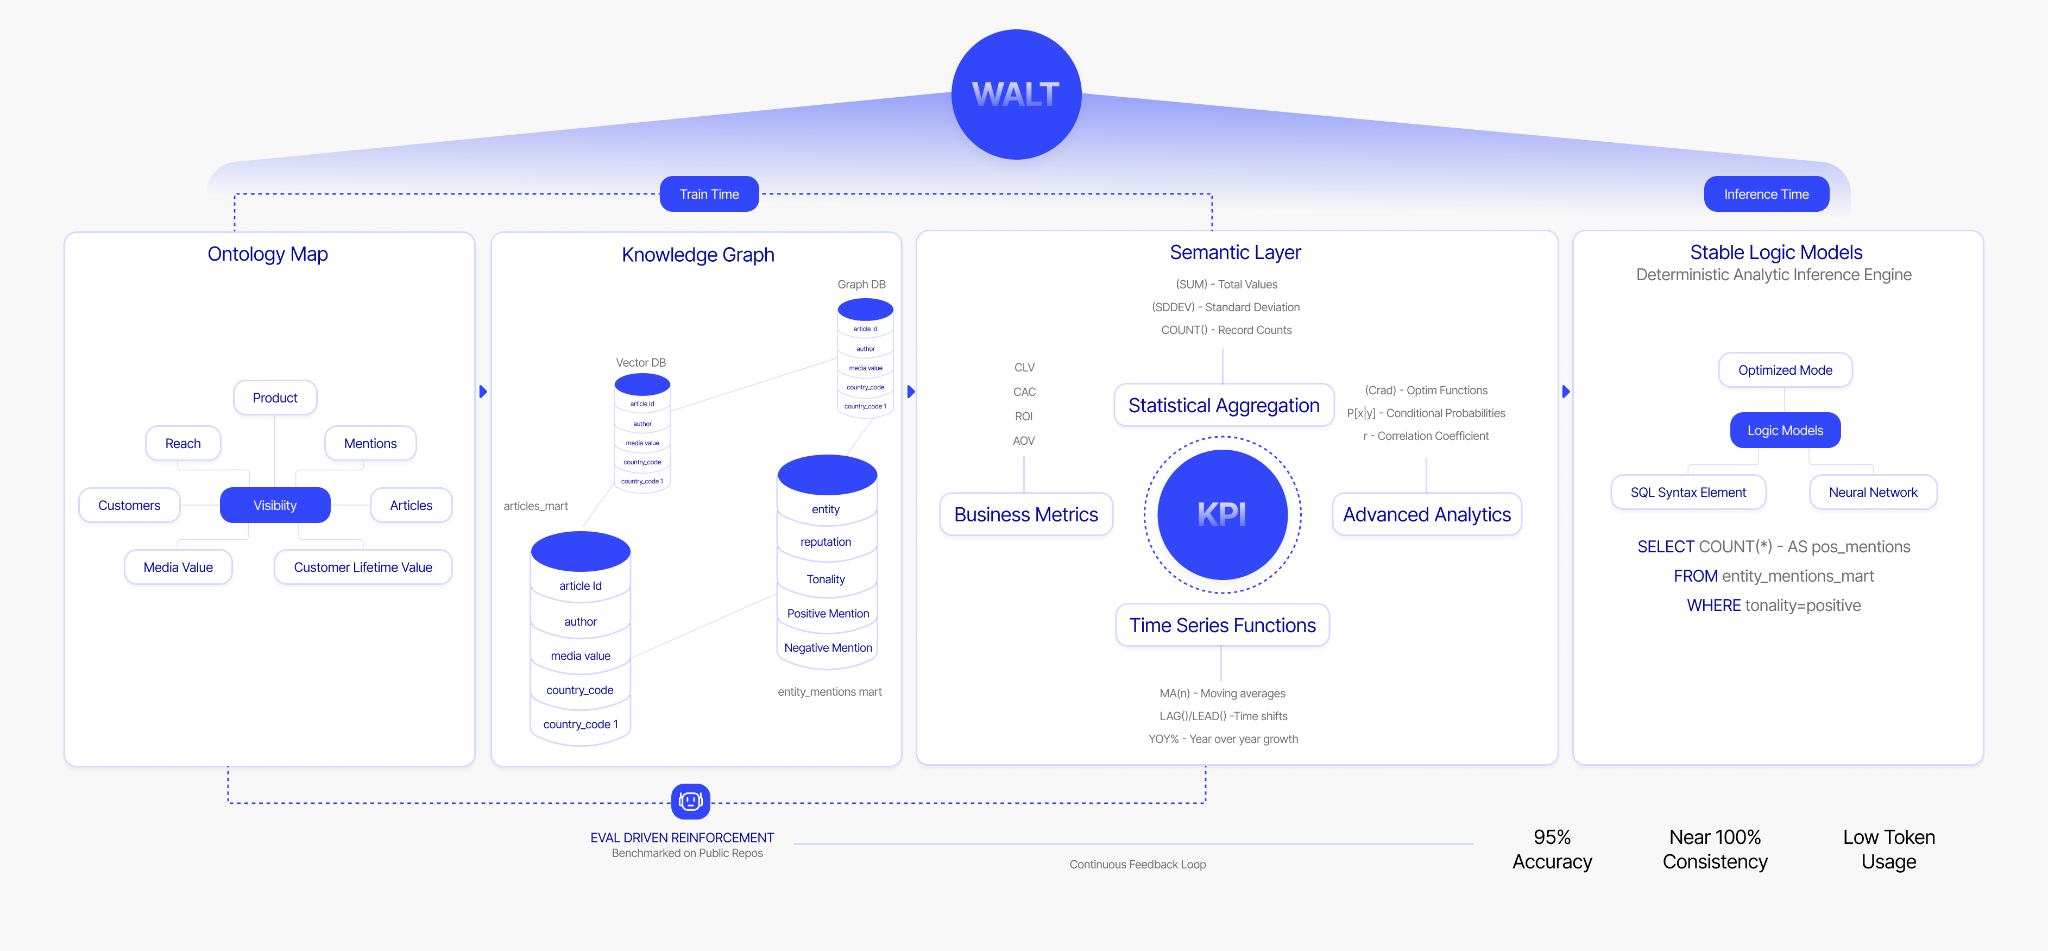
When these three components are unified and kept in sync, every question gets the same governed answer and every agent operates on the same ground truth.
Knowledge graphs, data catalogs, and context graphs: What is the difference?
These three concepts are often used interchangeably. They are not the same thing, and mixing them up is exactly why so many data teams end up with fragmented tooling that still cannot answer a basic business question reliably.
Here is how they are different, and why you need all three working together.
Data catalog: What exists
A data catalog documents your data assets. It tells you what tables are in your warehouse, what columns those tables contain, who owns each dataset, and when it was last updated. Tools like Alation, Collibra, and Atlan operate in this space.
A data catalog is essentially a well-organized inventory. It answers: "Do we have data about customer orders from the last 12 months?" If a team at a consumer goods company wants to know whether sales data from their European distribution centers exists in the warehouse, the catalog is where they start.
Knowledge graph: How things connect
A knowledge graph, traditionally the ERD (Entity Relationship Diagram) maps relationships. It shows which tables join to which other tables, which columns map to which business concepts, and where data flows from source to dashboard. It is the connective tissue of your data estate–call it your reasoning infrastructure.
WALT builds this layer autonomously, using data introspection, database log analysis, and existing code assets, rather than requiring a team of engineers to construct it by hand.
Context graph: Why something happened and what it affects
A context graph adds situational awareness on top of the knowledge graph. It provides the reasoning layer that answers not just "what exists" and "how things connect," but "why something happened, when it happened, and which downstream assets are affected."
This is what we call the Data Context Graph, built on ReasonBase™. It combines ontology, knowledge graph, and semantic layer into a single unified layer that gives every consumer, human or agent, a governed, consistent answer to any business question.
When a pipeline breaks at 2 AM and a data field stops populating correctly, a context graph can trace the root cause to its origin, identify every dashboard and report in the blast radius, surface the fix, and notify the right team, before anyone submits a ticket.
Data catalog vs. knowledge graph vs. context graph: Comparison at a glance
How they work together
These are complementary layers. A data catalog like Alation documents what exists. A knowledge graph built by WALT shows how things connect at inference time. A context graph provides the situational awareness that makes autonomous reasoning possible.
In practice, WALT integrates with existing catalogs bidirectionally. He harvests what is already documented, fills in what is missing, and adds the relationship and reasoning layers the catalog was never designed to provide. The existing investment in the catalog gets amplified, not replaced.
How WALT builds the knowledge graph
Manually constructing and maintaining a knowledge graph at enterprise scale requires deep data engineering expertise, months of effort, and continuous human attention. Data discovery and maintenance alone consume over 60% of data team bandwidth. The people needed to build this layer are the same people already overwhelmed by operational tickets.
WALT automates the construction with agentic data engineering. Here is how he builds it:
- Data introspection: WALT analyzes raw data directly to discover entity relationships, including many-to-many relationships and bridge tables, even when formal metadata like primary or foreign keys is absent.
- Database log analysis: Database logs carry hidden context: query patterns, lineage trails, how data moves through the system. WALT reads these logs to extract tribal knowledge that would otherwise require weeks of interviews with engineers.
- Existing asset ingestion: WALT can ingest XML exports from Oracle Analytics Cloud, Power BI DAX files, dbt models, and GitHub repositories. If your legacy system has any artifacts that encode historical business logic, WALT uses them as input.
- External documentation enrichment: When WALT identifies a third-party data source, he can query external API documentation to understand how metrics should be defined.
- Value-based relationship mapping: Rather than relying on column names, which are often misleading (revenue_final, revenue_corrected, revenue_v2), WALT analyzes the data inside the columns.
WALT builds a self-healing knowledge graph that never goes stale
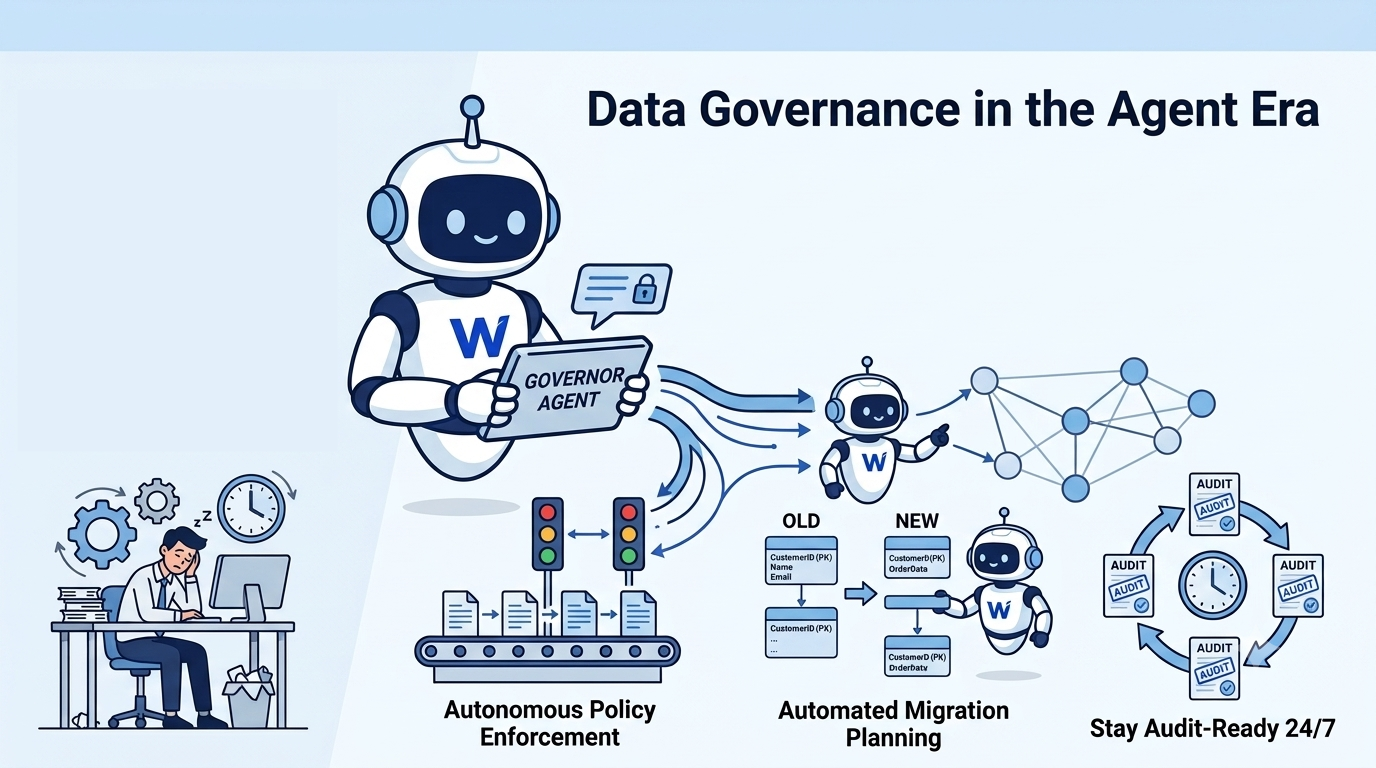
The biggest failure mode of the traditional ERD is that it stays wrong. Schema evolution is a fact of life in any enterprise data estate, and the ERD has no mechanism for handling it. WALT's agent layer was built specifically to address this.
WALT's knowledge graph mutates and self-reflects nightly. He evaluates new queries, compares them against the current graph, detects schema drift in source systems, and updates the reasoning layer automatically.
A breaking change in a source system does not cascade into broken dashboards. It becomes a managed, auditable update. Lineage is updated in real time, every change is versioned, and the data team gets a summary in their favorite communication tools before anyone files a ticket.
WALT facilitates scalable entity resolution at the graph level
One of the hardest problems in building a knowledge graph at enterprise scale is entity resolution: determining whether two records refer to the same real-world entity. At hundreds of thousands of rows, resolving that manually is not feasible.
Row-by-row LLM processing at that volume is prohibitively expensive and slow. WALT handles this by using vectorization and clustering to narrow the candidate space first, grouping likely matches by similarity before applying agent-level reasoning to the ambiguous cases.
The bulk of the work runs through deterministic, scalable methods and the agent steps in only where genuine judgment is required. This approach makes entity resolution viable at enterprise scale, without the compute cost that would otherwise make it impractical.
The ERD, reimagined, with WALT
The traditional Entity Relationship Diagram is an incomplete idea. While documenting structure is necessary, mapping it without meaning isn’t going to work in the age of agentic AI. For AI agents to reason reliably on enterprise data, they need context that explains what the data means, how it connects, why it exists, and who gets to query it for what purpose.
That is what a knowledge graph provides, and what a data context graph makes actionable. The data context graph, consisting of ontology, knowledge graph, and semantic layer, is dynamic, automated, consumption-driven, and continuously maintained.
This critical infrastructure serves as the reasoning layer vital for getting the most from agentic AI.
Ready to move from a static ERD to a living knowledge graph? See how WALT builds and maintains your Data Context Graph autonomously, starting from your most critical business questions.
FAQs about Entity Relationship Diagrams
1. What is the difference between an ERD and a knowledge graph?
An Entity Relationship Diagram maps the physical structure of a database: which tables exist, how they are joined, and what fields they contain. A knowledge graph maps meaning: which columns represent which business concepts, how data flows from source to dashboard, and what each metric actually means to each team. An ERD documents schema. A knowledge graph documents understanding.
2. What is a data context graph?
A data context graph is a unified reasoning layer that sits between your data warehouse and every downstream consumer. It combines three components: an ontology that resolves business vocabulary, a knowledge graph that maps how data assets relate to each other, and a semantic layer that governs metrics and KPIs. Together, they give AI agents and business users a consistent, governed answer to any question, regardless of who asks it or which tool they use.
3. Can a knowledge graph replace a data catalog?
No. They serve different purposes. A data catalog documents what data assets exist and who owns them. A knowledge graph maps how those assets connect and what they mean at inference time. A context graph adds situational awareness, tracing why something happened and what is affected downstream. The three layers are complementary.
4. What is the context gap in enterprise data?
The context gap is the distance between having data and being able to reason with it reliably. An organization can have petabytes of structured data in a warehouse and still be unable to answer a basic business question consistently, because the data lacks governed definitions, mapped relationships, and shared business logic. The context gap is why AI agents hallucinate on enterprise data even when the underlying data is accurate.
5. How does an automated knowledge graph differ from a manually built one?
A manually built knowledge graph requires data engineers to map relationships, define business concepts, and maintain lineage by hand. That process takes months and degrades the moment a source system changes. An automated knowledge graph is constructed by agents that introspect raw data, read database logs, ingest existing code assets, and update the graph continuously as schemas evolve. The result is a reasoning layer that stays current without requiring human intervention for every change.


Meet WALT, your next Data Engineer that builds and runs your entire data platform
.webp)

.webp)